Product News | October 11, 2021

How LUMO digital is building a DOOH business that stands out

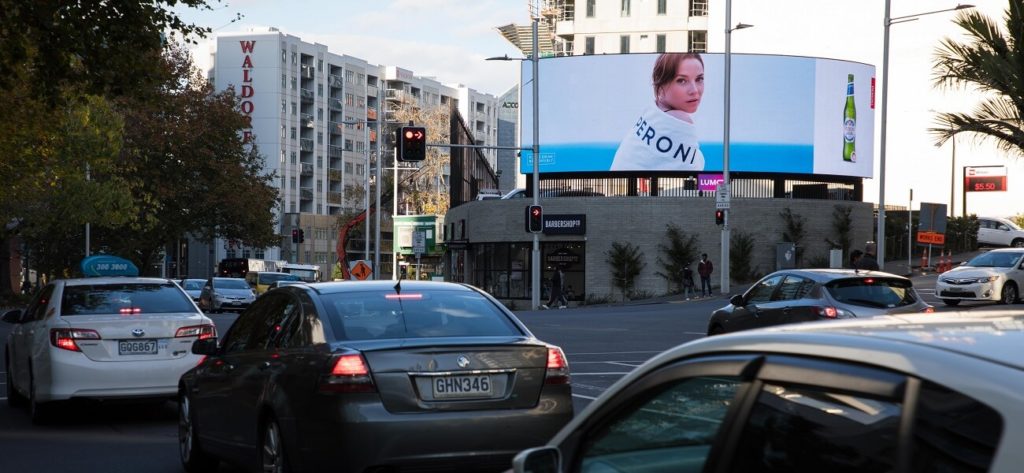
Shows an example of a digital billboard operated by LUMO Digital

A lot of people see billboards in their day-to-day life, but just seeing a billboard isn’t anything special. The magic happens when billboards become an experience.

That’s what New Zealand’s LUMO Digital is after. And with large format billboards in high-impact locations, innovative approaches to marketing, and an ambitious plan to drive a big shift in the way we think about outdoor advertising, the company is doing all the right things to fulfill its mission.

Born at happy hour

LUMO found its beginnings in 2016, in a time when many more brands and business owners were beginning to understand the exciting possibilities presented by a good DOOH network.

It was in the midst of that excitement that LUMO’s founders gathered together and, over drinks, conceived of the idea for their business. The vision: A new OOH business focused entirely on large-format digital billboards, one that would use smart technology to set a new standard for transparency and accountability in the industry.

Just months later, the business opened its doors, and LUMO was on its way, concentrating its efforts, at first, into building a presence in the critical Auckland market. It set out with a focus not on competing with top players in the region, but rather in delivering interesting new features that would set the brand apart. Today, thanks to those unique offerings, it has itself become one of the area’s dominant media brands.
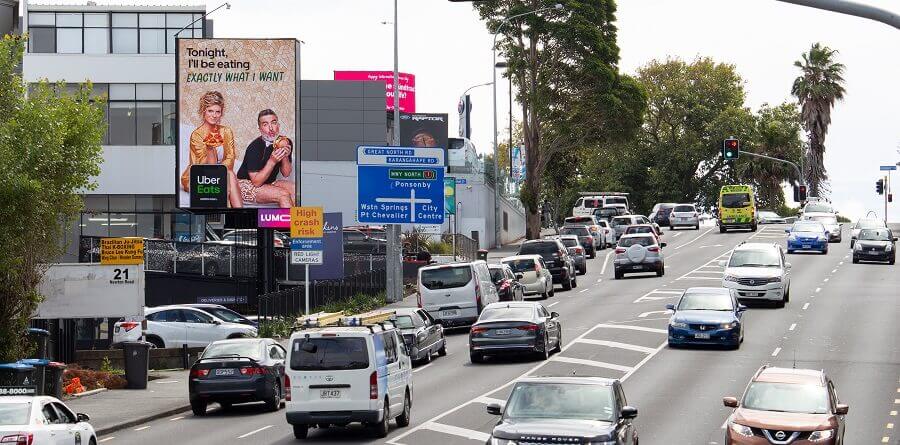
Shows a digital billboard operated by LUMO Digital, standing high above a road in New Zealand
LUMO’s unique approach to DOOH has helped it become a significant media player in New Zealand

A fresh approach to DOOH

In its attempt to rethink the way a DOOH business should operate, LUMO has come up with a number of unique flourishes that enhance the presentation and value of its inventory. All displays, for instance, are captured in drone footage, rather than the standard of static photography. It’s more dynamic, and it’s also more informative to potential buyers looking to assess a screen and location.

The displays are live-streamed for buyers, so that they can check in whenever they like and ensure that campaign requirements are being met. They are also connected to real-time audience analytics services to help ensure buyers get an accurate picture of who they are reaching and how campaigns are progressing against goals.

And all of it comes alongside a solid foundation of top-quality hardware and premium locations that help customer content really shine. The result is that LUMO’s network feels like the promise of DOOH fulfilled: a premium media offering that can really wow an audience.

Next up: More cool campaigns, more displays, and programmatic

It’s no surprise that LUMO’s network has attracted great content from high-profile customers. In the midst of the global COVID pandemic, it became home to dynamic campaigns that delivered a bit of lightness, fun, and support to audiences across New Zealand. One notable example pulled social media data to tie into a Burger King competition where the winner would receive free food and other prizes for a year. The content updated live to represent the current results, arranging contestants by results from highest to lowest.
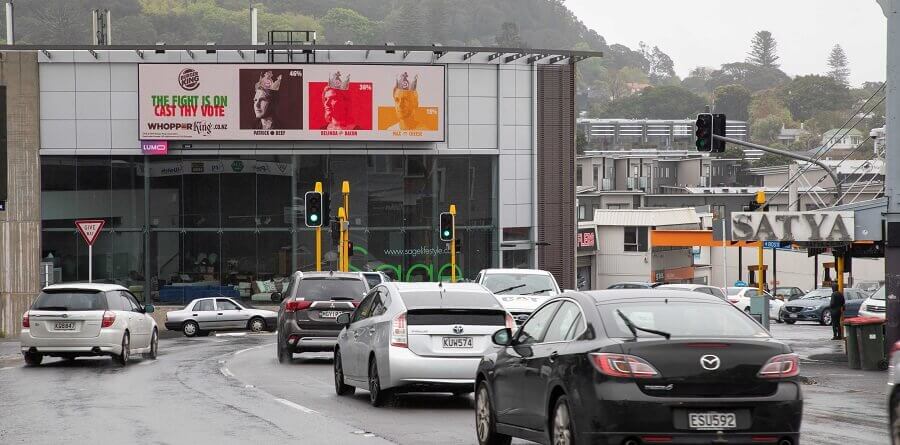
Shows a dynamic campaign for Burger King that displayed across New Zealand.
This dynamic Burger King campaign is a great example of the kind of work LUMO Digital attracts

Alongside Pitchblack Partners, a creative agency, the brand also developed its own campaign, “Up and Running.” The goal was to provide as many small and medium-sized businesses as possible with assistance creating a DOOH campaign and then delivering the campaign across LUMO’s network. The result: Hundreds of businesses were helped, more than 1,500 ads were displayed, and LUMO was able to provide some valuable assistance to a community in need.

An example of LUMO Digital's "Up and Running" campaign helping SMBs
LUMO’s “Up and Running” campaign was a great help to small and medium-sized businesses

Looking ahead, LUMO hopes to continue to deliver this kind of valuable and compelling content across an even larger network. Where today LUMO has a network of 24 large-format displays, it hopes to increase that count to as many as 40 by the end of 2021.

New investments in real-time audience analytics, as well as the introduction of programmatic transactions, are also in the cards for the near term. The goal, as ever, is to help more buyers deliver relevant advertising to their desired audience, and to ensure that the process remains as transparent and effective as possible.

LUMO and Broadsign

It takes time to come up with and execute on big ideas, but the day to day work involved in running a high-flying DOOH operation can make finding that time a challenge.

It’s for that reason that LUMO went looking for a platform that could help streamline its network and content management, as well as the detailed reporting that is so central to the business’ identity. It found its solution in a combination of the Ayuda platform and the Broadsign Reach programmatic SSP.
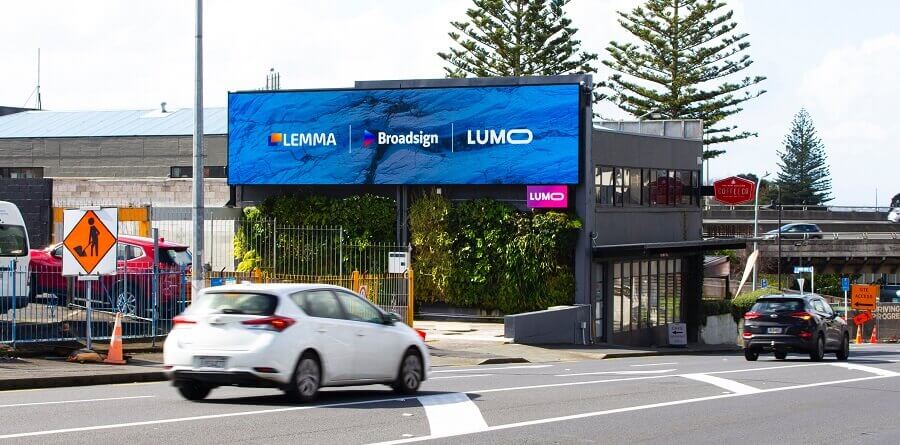
Shows a programmatic ad displayed by LUMO Digital via Broadsign Reach
LUMO Digital’s network benefits from greater efficiency through the Ayuda Platform and the Broadsign Reach SSP

With Ayuda, LUMO has an integrated platform for managing all its OOH assets, as well as a streamlined solution for scheduling media across its network. This represents a substantial benefit in its own right, but it’s through the integration with Broadsign Reach that the business will gain the biggest advantage.

Transacting programmatically via Reach will allow LUMO to automate delivery of content to the best screens, at the best times, to fulfill the buyer’s needs. Near-live reporting through Reach, meanwhile, will help LUMO ensure that it is delivering on its obligations, as well as continually improve on its pricing and deal priorities to the mutual benefit of LUMO and its customers.

For LUMO, it’s an exciting prospect to be able to offer access to its premium inventory to customers in near-real time. It allows for on-demand purchasability whenever a campaign can deliver the best results, as well as the option for buyers to optimize their campaigns on the fly. These are the kinds of capabilities that are sure to help LUMO fulfill its goal of making its network as high-impact and high-value as possible.

See how Broadsign’s products can help your OOH business shine
Request your free live demo today

Product News | October 11, 2021

Understanding (D)OOH metrics: How to measure the success of out-of-home advertising

Understanding the right metrics can make or break your strategy when managing any advertising campaign—and digital out-of-home (DOOH) is no different. Thanks to evolving out-of-home (OOH) measurement and attribution capabilities, successful DOOH advertising now goes beyond displaying an ad on a digital billboard; it’s about reaching the right audience at the right moment with measurable impact. In today’s advertising landscape, where every dollar must show results, relying on outdated methods to track impressions and reach won’t cut it.

In this blog, we’ll break down the key metrics that define DOOH advertising and explain how they stand apart from other forms of digital advertising. Whether you’re a seasoned marketer or new to out-of-home advertising, understanding these metrics is crucial to leveraging DOOH effectively in your marketing strategy.

Jump to:

How digital technology transformed out-of-home ad measurement

Tracking OOH impressions used to be tricky due to its broad, one-to-many nature. For example, measuring how many people pass a billboard is more complex than tracking views on an online ad. But with digital OOH, that’s changing.

Unlike static OOH, which relied on broad reach estimates, DOOH uses technology like in-screen sensors, mobile tracking, and geolocation to provide more accurate audience insights. Advertisers can now track who’s viewing ads, when, and even actions like visiting a store or website. Programmatic DOOH (pDOOH) has further transformed the space, allowing automated ad buying and detailed performance reports. This level of tracking and attribution brings DOOH closer to the precision of online advertising, making it a key part of today’s marketing strategy.

READ ALSO: Learn how media buyers can account for the growing demand for this format within their existing teams with our tips on structuring your buying team for success with pDOOH

A busy street with different kinds of digital signage and DOOH installations. Metrics research can help the network owners understand their audiences.
DOOH metrics can be researched and tracked in a number of different ways

DOOH advertising performance metrics

Like any form of advertising, digital OOH has certain quantifiable data points — metrics —that advertisers and media buyers rely on to assess the performance of their campaigns. These metrics help determine whether an ad is reaching its target audience, whether it’s generating the right amount of exposure, and how well it’s driving engagement or conversions.

Some of the most common metrics used to measure DOOH performance include:

Impressions

  • Definition: The total number of times an ad has potentially been viewed.
  • How it’s calculated: Impressions are typically calculated using traffic data, sensor-based tracking, or audience measurement technologies (like GPS data or facial recognition software). For example, if 100,000 vehicles pass by a digital billboard each day, and each vehicle has an average of 1.5 occupants, then the number of impressions per day would be approximately 150,000.

The most important metric in digital out-of-home is the number of impressions that a screen gets over a given time period. Impressions help measure performance by estimating the number of times people view an advertisement, and they often determine how much an ad will cost. However, determining how many impressions a screen gets is a little tricky. 

With online advertising, one appearance of an ad on one screen is likely to reach one person. But since out-of-home is a one-to-many medium, with several people likely to be looking at a screen at any given moment, media owners apply an impression multiplier to each ad play on every individual screen. 

Determining these dynamic multipliers requires real-time (or relatively real-time) data collection. Different networks rely on different tools to gather this data. Cinemas, for instance, can use ticket sales to get a good idea of how many people see a given ad up on the screen. Other businesses might use cameras and sensors integrated with a DOOH analytics platform like Quividi or Linkett to collect view data on an ongoing basis. Still, others might use an independent third-party research firm like Geopath or Nielsen to conduct a statistical analysis of the likely views that a screen will get.

Reach & frequency

  • Definitions: Reach measures how many unique people are exposed to your ad, while frequency indicates how often those people see it over a given period.
  • How they’re calculated:
    • Reach estimates the unique viewers from total impressions by distinguishing repeat views from new ones. For example, if an ad location has 500,000 unique passersby in a week, the reach is 500,000.
    • Frequency is calculated by dividing total impressions by reach. For example, if an ad has 1,000,000 impressions and reaches 250,000 unique people, the frequency would be 4 (1,000,000 ÷ 250,000).

Reach and frequency, both based on impressions, capture different aspects of a campaign’s effectiveness. They help advertisers balance exposure: too few views risk low recall, while too many can lead to ad fatigue.

Engagement

  • Definition: The level of interaction or attention that the audience has with the ad, often measured by actions like QR code scans, taps on a touchscreen, or other measurable forms of interaction.
  • How it’s calculated: Engagement can be tracked using various tools like sensors, cameras, or interaction points (e.g., mobile apps or touch screens). For example, if 500 people scan a QR code from a digital display out of 50,000 impressions, the engagement rate would be 1% (500 ÷ 50,000).

DOOH can feature interactive elements like QR codes, touch screens, or mobile app integrations that invite viewers to engage with the content directly. This precise tracking gives a clear understanding of the ad’s ability to capture attention and drive meaningful engagement from the audience.

READ ALSO: Learn how brands and advertisers can create interactive consumer experiences through the use of dynamic QR codes

Conversion rate

  • Definition: The percentage of individuals who take a desired action after viewing the ad, such as making a purchase, signing up for a service, or downloading an app.
  • How it’s calculated: Conversion rate is typically calculated by dividing the number of conversions (e.g., purchases or sign-ups) by the total number of interactions or impressions. For example, if 200 people make a purchase after seeing the ad out of 500,000 impressions, the conversion rate would be 0.4% (200 ÷ 50,000).

Today’s diverse data sources and analytics tools allow advertisers to precisely track post-exposure behaviors, accurately attribute conversions, and better assess campaign success.

Attribution strategies depend on campaign goals. For brand awareness, metrics like increased branded searches, social media followers, direct website traffic, or physical store visits can indicate success. For greater accuracy, device IDs can track actions: if someone searches for a brand shortly after passing a DOOH ad, that search can likely be attributed to the ad exposure.

A woman holding a tablet. On the tablet's screen are charts and figures relating to finances. Reviewing data in this way is an important method of determining DOOH campaign effectiveness.
Comparing sales before and after a campaign is a common method of determining DOOH campaign success

READ MORE: Learn all about brand lift studies, tracking pixels, and other types of DOOH attribution available to today’s marketers in our in-depth guide to measurement, attribution, and audience extension

Leveraging pDOOH for successful campaign targeting

While impressions and conversion rates are key for assessing campaign success, programmatic DOOH offers advanced metrics that give deeper insights into audience behavior and real-time engagement. Here are some pDOOH-enabled metrics that elevate omnichannel campaign measurement:

Dynamic Creative Optimization (DCO) metrics

One key benefit of pDOOH is Dynamic Creative Optimization (DCO), which adjusts DOOH creatives in real-time based on factors like weather, time of day, audience profiles, or nearby events. DCO allows advertisers to customize ad elements (images, text, offers, CTAs) to match user preferences. For example, a QSR might display various menu items, adjusting in real-time based on demographics, browsing history, and environmental data such as location or weather.

Effective DCO requires ongoing measurement using metrics that track general DOOH performance (dwell time, impressions, interaction rate) and specific DCO impact. These metrics show how engagement or conversion rates change with factors like weather, local events, or foot traffic.

Key performance indicators for DCO in DOOH campaigns include:

  • Creative variants CTR: Measures interaction, like QR code responses, for different versions.
  • Engagement with creative elements: Tracks which elements resonate most (e.g., weather-based messaging).
  • Creative rotation effectiveness: Compares performance across different times or conditions.
  • Weather, time, and location relevance: Assesses engagement based on real-time factors.

Cross-channel conversion metrics

Advanced data analytics in pDOOH connect offline and online interactions, providing a complete view of the consumer journey. Using device ID matching and geo-fencing, advertisers track DOOH ad impact on website visits, app downloads, social media engagement, and store visits, measuring how exposure drives cross-channel actions.

Key metrics highlighting the cross-channel impact of DOOH include:

  • Walk-in rate: Measures the percentage of people who visit a location after seeing a DOOH ad, often tracked via mobile location data or GPS.
  • Online conversion rate: Calculates the percentage of website visitors who convert (e.g., sign up, purchase) after seeing a DOOH ad.
  • Cross-device conversions: Tracks conversions on other devices after DOOH exposure, using multi-device tracking.
  • Social media interaction rate: Measures increased social media activity (e.g., likes, shares, follows) from DOOH exposure, often tracked with geo-fencing.
  • Multi-touchpoint conversion attribution: Assigns conversion credit to DOOH within a larger multi-channel strategy, showing its role in cross-channel journeys.

See how real-time measurement improves pDOOH ROI

Check out our collection of case studies & customer spotlights to find real-world examples of pDOOH-enabled metrics in action!