Product News | October 11, 2021

How digital restaurant signage can serve up better content and experiences for diners

In 1955, restaurants represented approximately 25% of US spending on food. By 2019, that number had risen to 51%.

Why? Explanations vary, but it seems to be partly convenience, partly the fun of dining out. There’s also the greater access afforded by food delivery services from foodora, Uber, DoorDash, and many others. It also helps that the range of options today hits a huge variety of price points and dietary options.

Appealing to such a diversity of preferences means the “restaurant industry” represents enormous variety, many unique approaches taken to meet customer demand. What unites all players in the space is a need to communicate effectively with diners and establish the atmosphere they are looking for.

Here’s how digital signage makes that easier.

Sell more (and smarter) with dynamic digital menus

The old way of using static menus has quickly been overtaken, at least by most major players in the QSR and fast casual spaces, by digital menu boards. Brighter, with more vivid color, and capable of displaying moving imagery, digital menus are more attractive on a visceral level. The research bears that out, with a study by Ocean Outdoor finding that moving content on signage is 2.5 times as effective at driving an emotional reaction as static content.
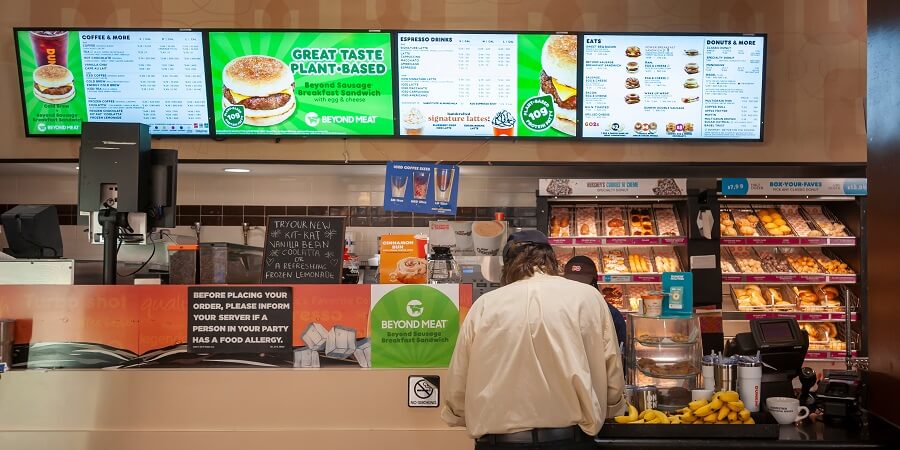
A man standing at a counter. Digital menu boards hang overhead
The enhanced visuals of digital menu boards are more effective at selling to diners

This improvement is just the baseline, though. With intelligent software powering menu displays, it’s possible to add dynamism and automation for better sales and a more fluid customer experience.

Sell upgrades and combos with flashier advertising

It’s easier to sell more to an existing customer than to sell to a new customer, so doing a good job of upselling is a key task restaurants should take on. With digital menu boards, it’s easy to create animated videos that showcase different combos or upsell options and demonstrate the value that they offer.

Highlight the day’s deals for a little extra enticement

Special time-limited products are a big draw (#szechuansauce, anyone?) and there’s no better way to draw attention to special menu items than to give them prominent placement on a bright, beautiful display.

Automatically stop promoting items that have sold out

It’s bad enough when regular menu items sell out, but when time-limited specials with cult followings and fever-pitch excitement sell out, you can have something of a PR crisis on your hands (#szechuansauce, anyone?)

Modern digital menu solutions can integrate the digital menu system with point-of-sale software to track the status of items being sold and remove sold-out foods from being displayed on menus. It’s a way to help manage guest expectations and prevent disappointment from spiralling into a newsworthy story.

Put your guests in control with touchscreens

Digital screens aren’t just a passive medium through which to deliver menus and other content, or at least they don’t have to be. Interactive displays have made major inroads in the restaurant industry in the past several years, and in multiple different forms.

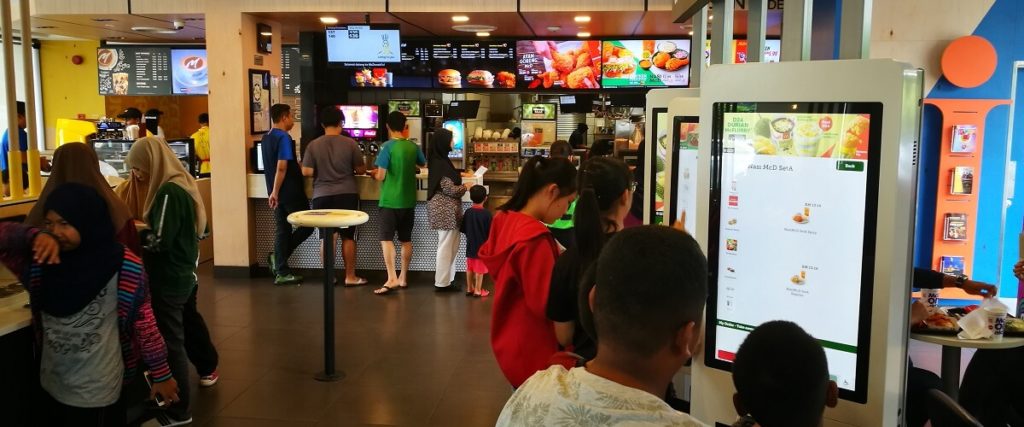
The McDonald’s touchscreen kiosks are a prominent example, and have boosted sales from 3-9 % in many of the regions in which they have been deployed, but they aren’t the only example. Many sushi restaurants, for instance, handle ordering with screens installed or otherwise attached to tables. Information screens in all manner of restaurants, meanwhile, can be used to provide a more self-directed and informative avenue toward discovering more detailed ingredient lists or allergen warnings.
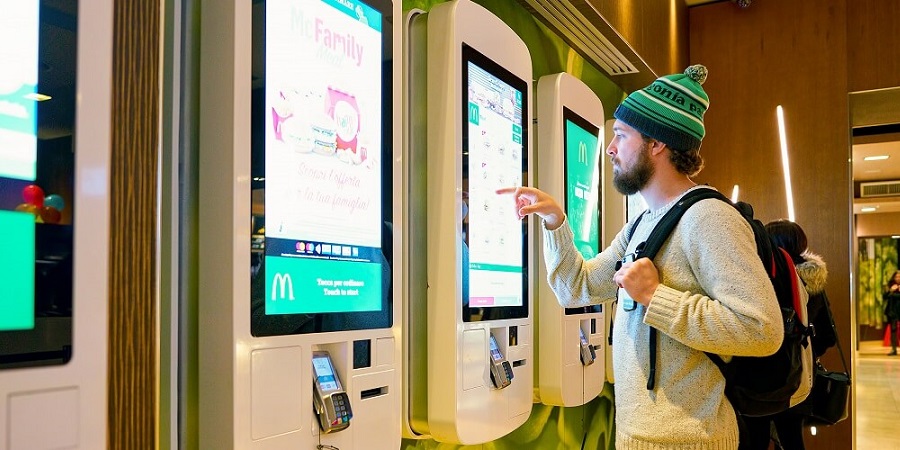
A man at a McDonald's self-serve touchscreen
Interactive displays have helped McDonald’s boost sales in many regions

Best of all, when touch screens are not in use, they can also be used to deliver informational or promotional content to people who are in the vicinity, just like regular screens do.

Deliver informative or attractive content to your customers

Digital displays can be used for purposes other than just menus and advertising. Audiences in many restaurants appreciate having ambient content to accompany their coffee, lunch, or after work meal.

For QSRs, coffee shops, and other casual locales, things like news headlines, weather, and general diversions are likely to grab guests’ attention and entertain them for the duration of their stay. For sports pubs, screens could be used to run interesting stats or trivia about teams playing in that day’s game. But even more upscale environments can make use of digital signage. Digital signage can be used to display modern artwork that creates a unique ambiance and provokes conversation among patrons.

Example: While this media wall is not from a restaurant, it provides a striking demonstration of the artistic potential offered by digital signage.

It’s worth noting that this content and the screens it appears on can all be run through the same digital signage platform as any other menu boards, advertising displays, or interactive screens on your network.

Use screens to flaunt your cred and get social

Restaurant-goers are highly self-directed nowadays, with many spending a fair amount of time researching their options before ever setting foot in the door. According to Trip Advisor’s “Influences on Diner Decision-making” report, about 94% of US diners claim to be influenced by reviews when going to a restaurant, with ratings websites like Trip Advisor, Yelp, Google Maps. and others taking the top spot for most influential.

Achieving a great rating takes hard work, a good product, dedication to customer service, and a bit of luck. If you’re proud of your score on one or more of these services, why not put them up for all to see inside of your restaurant? It’s a little extra proof that your establishment has become a destination to return to for continued enjoyment.

As a bonus, the reviews can be accompanied by appeals to diners inside of the restaurant to take the time to leave their own reviews – a good way to keep growing your online influence.

It bears mentioning, too, that social media posts about your brand can do a lot of good inside of your establishment, not just inside of an app. It’s like unleashing an endless team of great amateur photographers to bring your menu to life. Showcase selected posts tagged at your restaurant, or that display a particular hashtag, and you can create a sense of community while simultaneously marketing your offerings more creatively and compellingly than you likely could otherwise.
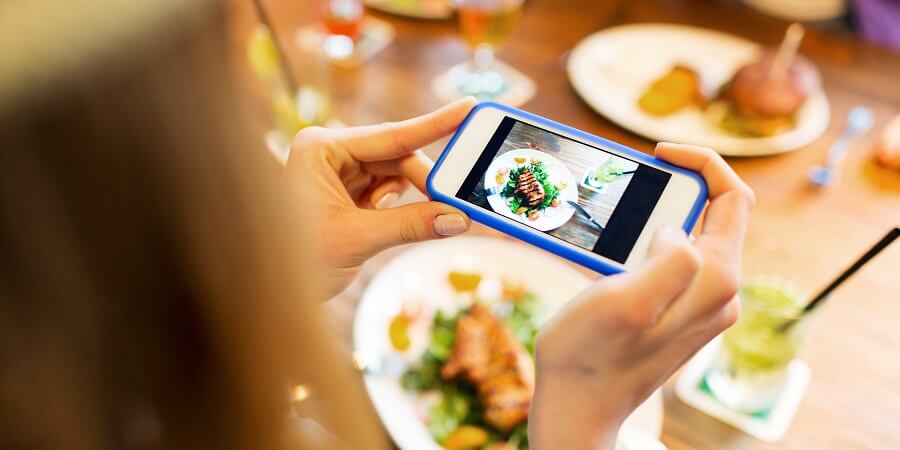
A woman photographing her food with a smartphone. She's going to make a social media post about her experience in the restaurant she's eating in
Digital signage can be a great prompt to get people to write reviews or create social media posts about your restaurant

Show off your loyalty program to bring more customers in

Loyalty programs are good for business. According to research by Bond Brand, 70% of loyalty program members say that the program makes them more likely to recommend the brand to others. About 77% say that the program makes it more likely for them to do business with the brand, and 63% say that they plan their spending around loyalty program benefits.

With digital displays inside of a restaurant, the brand can easily promote the steps necessary to achieve membership, or advertise special promotions uniquely available to members. Taking this a step further, with displays that can be interacted with through touch, NFC, or QR codes, is another good way to boost engagement with your guests and create more tailored, memorable experiences.

Do you want to drove more profits and create better restaurant experiences?

Get your free Broadsign demo to see how digital signage can help!
Product News | October 11, 2021

Understanding (D)OOH metrics: How to measure the success of out-of-home advertising

Understanding the right metrics can make or break your strategy when managing any advertising campaign—and digital out-of-home (DOOH) is no different. Thanks to evolving out-of-home (OOH) measurement and attribution capabilities, successful DOOH advertising now goes beyond displaying an ad on a digital billboard; it’s about reaching the right audience at the right moment with measurable impact. In today’s advertising landscape, where every dollar must show results, relying on outdated methods to track impressions and reach won’t cut it.

In this blog, we’ll break down the key metrics that define DOOH advertising and explain how they stand apart from other forms of digital advertising. Whether you’re a seasoned marketer or new to out-of-home advertising, understanding these metrics is crucial to leveraging DOOH effectively in your marketing strategy.

Jump to:

How digital technology transformed out-of-home ad measurement

Tracking OOH impressions used to be tricky due to its broad, one-to-many nature. For example, measuring how many people pass a billboard is more complex than tracking views on an online ad. But with digital OOH, that’s changing.

Unlike static OOH, which relied on broad reach estimates, DOOH uses technology like in-screen sensors, mobile tracking, and geolocation to provide more accurate audience insights. Advertisers can now track who’s viewing ads, when, and even actions like visiting a store or website. Programmatic DOOH (pDOOH) has further transformed the space, allowing automated ad buying and detailed performance reports. This level of tracking and attribution brings DOOH closer to the precision of online advertising, making it a key part of today’s marketing strategy.

READ ALSO: Learn how media buyers can account for the growing demand for this format within their existing teams with our tips on structuring your buying team for success with pDOOH

A busy street with different kinds of digital signage and DOOH installations. Metrics research can help the network owners understand their audiences.
DOOH metrics can be researched and tracked in a number of different ways

DOOH advertising performance metrics

Like any form of advertising, digital OOH has certain quantifiable data points — metrics —that advertisers and media buyers rely on to assess the performance of their campaigns. These metrics help determine whether an ad is reaching its target audience, whether it’s generating the right amount of exposure, and how well it’s driving engagement or conversions.

Some of the most common metrics used to measure DOOH performance include:

Impressions

  • Definition: The total number of times an ad has potentially been viewed.
  • How it’s calculated: Impressions are typically calculated using traffic data, sensor-based tracking, or audience measurement technologies (like GPS data or facial recognition software). For example, if 100,000 vehicles pass by a digital billboard each day, and each vehicle has an average of 1.5 occupants, then the number of impressions per day would be approximately 150,000.

The most important metric in digital out-of-home is the number of impressions that a screen gets over a given time period. Impressions help measure performance by estimating the number of times people view an advertisement, and they often determine how much an ad will cost. However, determining how many impressions a screen gets is a little tricky. 

With online advertising, one appearance of an ad on one screen is likely to reach one person. But since out-of-home is a one-to-many medium, with several people likely to be looking at a screen at any given moment, media owners apply an impression multiplier to each ad play on every individual screen. 

Determining these dynamic multipliers requires real-time (or relatively real-time) data collection. Different networks rely on different tools to gather this data. Cinemas, for instance, can use ticket sales to get a good idea of how many people see a given ad up on the screen. Other businesses might use cameras and sensors integrated with a DOOH analytics platform like Quividi or Linkett to collect view data on an ongoing basis. Still, others might use an independent third-party research firm like Geopath or Nielsen to conduct a statistical analysis of the likely views that a screen will get.

Reach & frequency

  • Definitions: Reach measures how many unique people are exposed to your ad, while frequency indicates how often those people see it over a given period.
  • How they’re calculated:
    • Reach estimates the unique viewers from total impressions by distinguishing repeat views from new ones. For example, if an ad location has 500,000 unique passersby in a week, the reach is 500,000.
    • Frequency is calculated by dividing total impressions by reach. For example, if an ad has 1,000,000 impressions and reaches 250,000 unique people, the frequency would be 4 (1,000,000 ÷ 250,000).

Reach and frequency, both based on impressions, capture different aspects of a campaign’s effectiveness. They help advertisers balance exposure: too few views risk low recall, while too many can lead to ad fatigue.

Engagement

  • Definition: The level of interaction or attention that the audience has with the ad, often measured by actions like QR code scans, taps on a touchscreen, or other measurable forms of interaction.
  • How it’s calculated: Engagement can be tracked using various tools like sensors, cameras, or interaction points (e.g., mobile apps or touch screens). For example, if 500 people scan a QR code from a digital display out of 50,000 impressions, the engagement rate would be 1% (500 ÷ 50,000).

DOOH can feature interactive elements like QR codes, touch screens, or mobile app integrations that invite viewers to engage with the content directly. This precise tracking gives a clear understanding of the ad’s ability to capture attention and drive meaningful engagement from the audience.

READ ALSO: Learn how brands and advertisers can create interactive consumer experiences through the use of dynamic QR codes

Conversion rate

  • Definition: The percentage of individuals who take a desired action after viewing the ad, such as making a purchase, signing up for a service, or downloading an app.
  • How it’s calculated: Conversion rate is typically calculated by dividing the number of conversions (e.g., purchases or sign-ups) by the total number of interactions or impressions. For example, if 200 people make a purchase after seeing the ad out of 500,000 impressions, the conversion rate would be 0.4% (200 ÷ 50,000).

Today’s diverse data sources and analytics tools allow advertisers to precisely track post-exposure behaviors, accurately attribute conversions, and better assess campaign success.

Attribution strategies depend on campaign goals. For brand awareness, metrics like increased branded searches, social media followers, direct website traffic, or physical store visits can indicate success. For greater accuracy, device IDs can track actions: if someone searches for a brand shortly after passing a DOOH ad, that search can likely be attributed to the ad exposure.

A woman holding a tablet. On the tablet's screen are charts and figures relating to finances. Reviewing data in this way is an important method of determining DOOH campaign effectiveness.
Comparing sales before and after a campaign is a common method of determining DOOH campaign success

READ MORE: Learn all about brand lift studies, tracking pixels, and other types of DOOH attribution available to today’s marketers in our in-depth guide to measurement, attribution, and audience extension

Leveraging pDOOH for successful campaign targeting

While impressions and conversion rates are key for assessing campaign success, programmatic DOOH offers advanced metrics that give deeper insights into audience behavior and real-time engagement. Here are some pDOOH-enabled metrics that elevate omnichannel campaign measurement:

Dynamic Creative Optimization (DCO) metrics

One key benefit of pDOOH is Dynamic Creative Optimization (DCO), which adjusts DOOH creatives in real-time based on factors like weather, time of day, audience profiles, or nearby events. DCO allows advertisers to customize ad elements (images, text, offers, CTAs) to match user preferences. For example, a QSR might display various menu items, adjusting in real-time based on demographics, browsing history, and environmental data such as location or weather.

Effective DCO requires ongoing measurement using metrics that track general DOOH performance (dwell time, impressions, interaction rate) and specific DCO impact. These metrics show how engagement or conversion rates change with factors like weather, local events, or foot traffic.

Key performance indicators for DCO in DOOH campaigns include:

  • Creative variants CTR: Measures interaction, like QR code responses, for different versions.
  • Engagement with creative elements: Tracks which elements resonate most (e.g., weather-based messaging).
  • Creative rotation effectiveness: Compares performance across different times or conditions.
  • Weather, time, and location relevance: Assesses engagement based on real-time factors.

Cross-channel conversion metrics

Advanced data analytics in pDOOH connect offline and online interactions, providing a complete view of the consumer journey. Using device ID matching and geo-fencing, advertisers track DOOH ad impact on website visits, app downloads, social media engagement, and store visits, measuring how exposure drives cross-channel actions.

Key metrics highlighting the cross-channel impact of DOOH include:

  • Walk-in rate: Measures the percentage of people who visit a location after seeing a DOOH ad, often tracked via mobile location data or GPS.
  • Online conversion rate: Calculates the percentage of website visitors who convert (e.g., sign up, purchase) after seeing a DOOH ad.
  • Cross-device conversions: Tracks conversions on other devices after DOOH exposure, using multi-device tracking.
  • Social media interaction rate: Measures increased social media activity (e.g., likes, shares, follows) from DOOH exposure, often tracked with geo-fencing.
  • Multi-touchpoint conversion attribution: Assigns conversion credit to DOOH within a larger multi-channel strategy, showing its role in cross-channel journeys.

See how real-time measurement improves pDOOH ROI

Check out our collection of case studies & customer spotlights to find real-world examples of pDOOH-enabled metrics in action!